Daily U.S. Weather Maps
A national snapshot of key weather signals across the continental United States. Each map shows a fixed, daily-updated dataset. Regional analysis, custom time ranges, and data exports are available inside the WeatherMapping platform.
The same mapping framework extends far beyond the United States. WeatherMapping supports dozens of weather and climate variables across the globe, from country-level views to custom-defined regions and exact latitude-longitude locations. Users can analyze historical conditions, monitor current signals, and evaluate forecasts anywhere in the world with consistent datasets and controls.
Access the full global platform, unlock advanced variables, custom regions, and data exports by subscribing to WeatherMapping. Subscribe →
Viewing static snapshots. Interactive maps are available on desktop or tablet.
Get these U.S. weather maps emailed to you daily (free)
Full-resolution maps delivered automatically. No account required.
One email per day. Unsubscribe anytime.
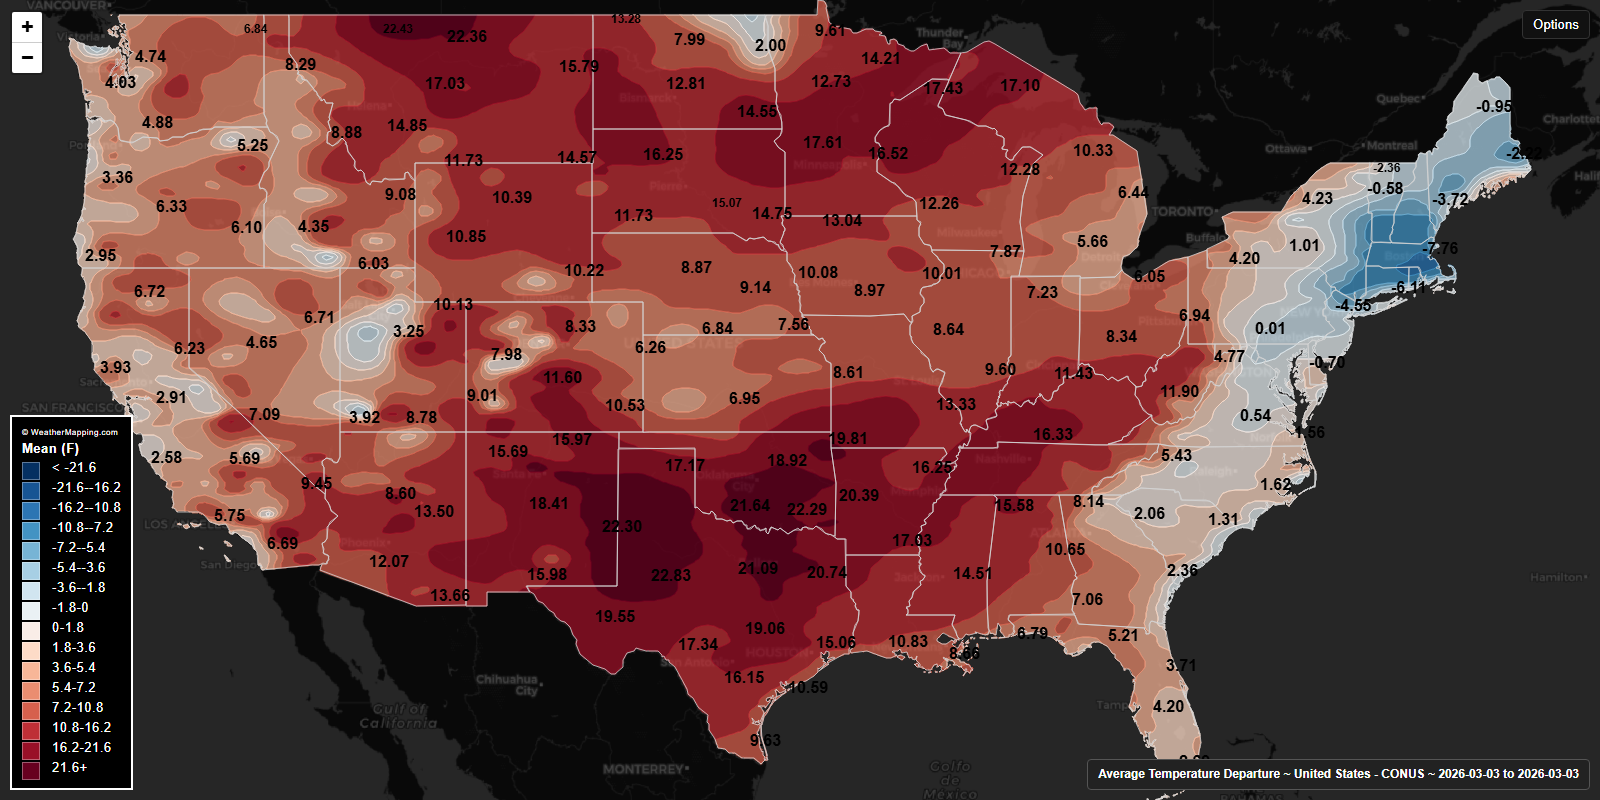
Average Temperature Departure (Today)
Todays daily departure of average temperature from the long-term normal.
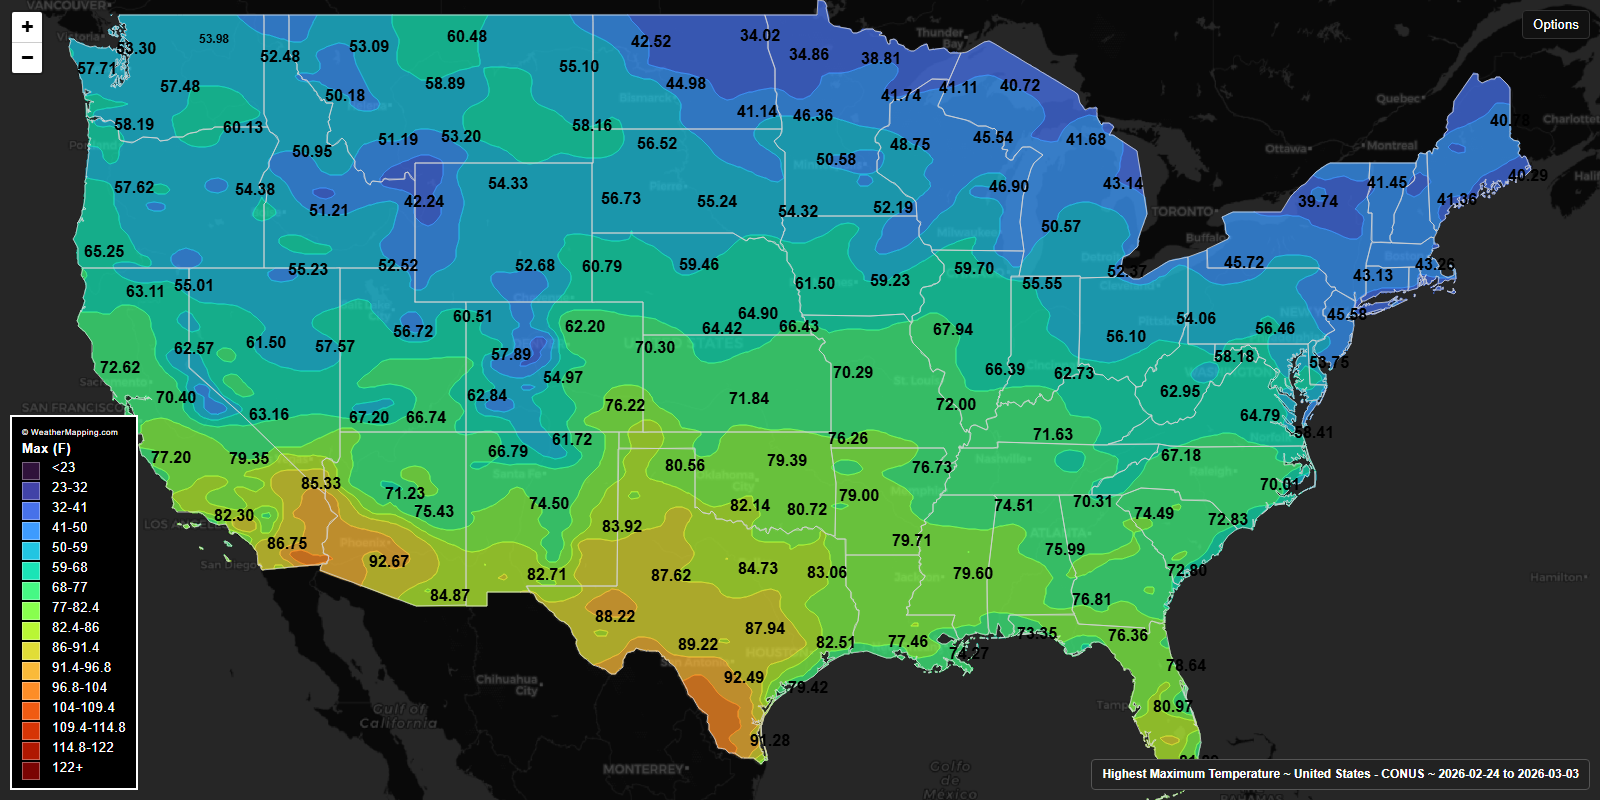
Highest Maximum Temperature (Last 7 Days)
Highest observed daily maximum temperature over the past seven days.
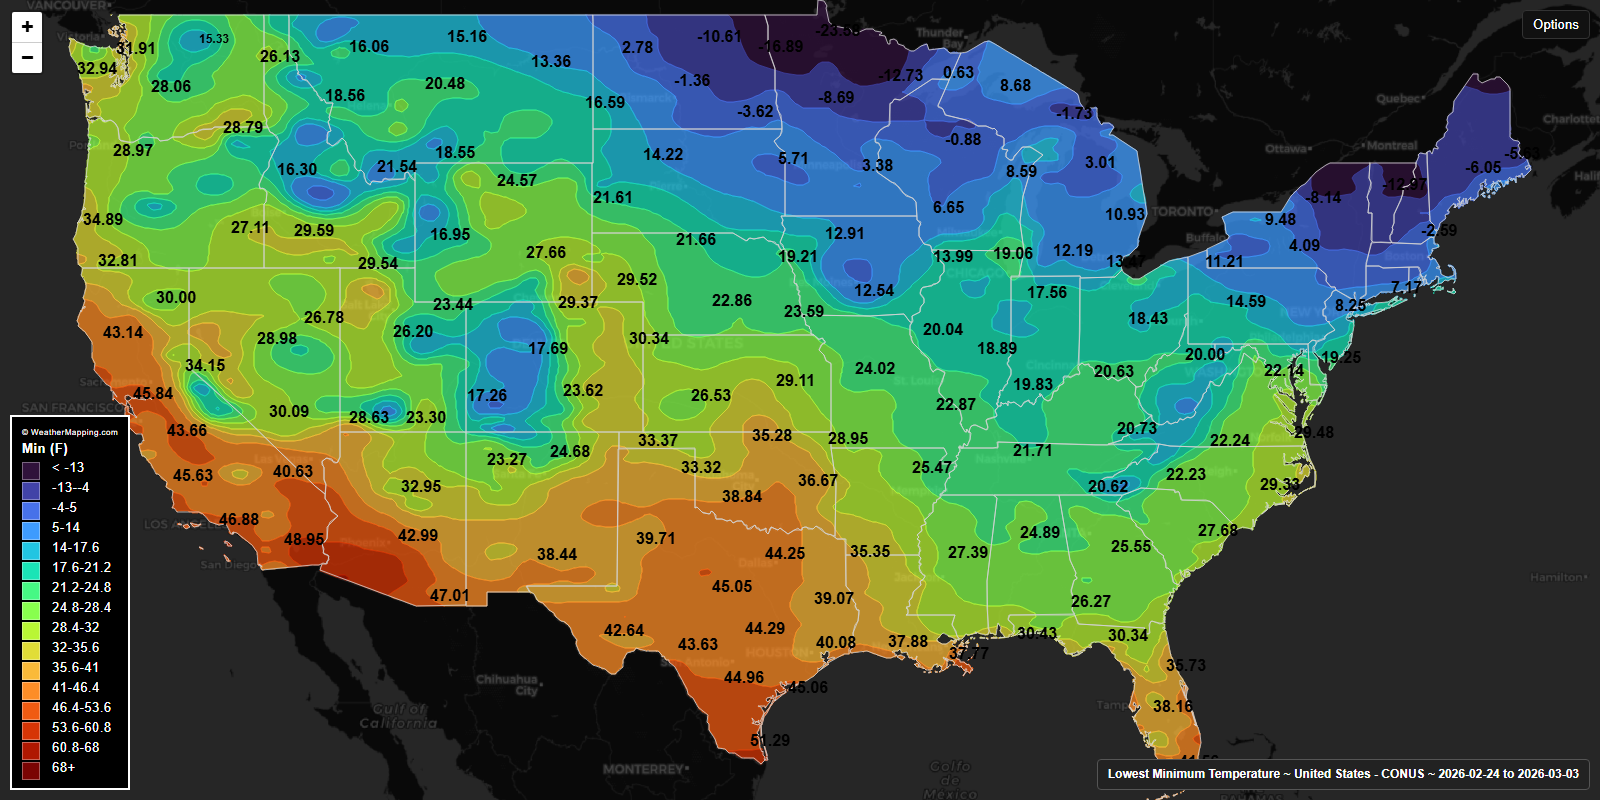
Lowest Minimum Temperature (Last 7 Days)
Lowest observed daily minimum temperature over the past seven days.
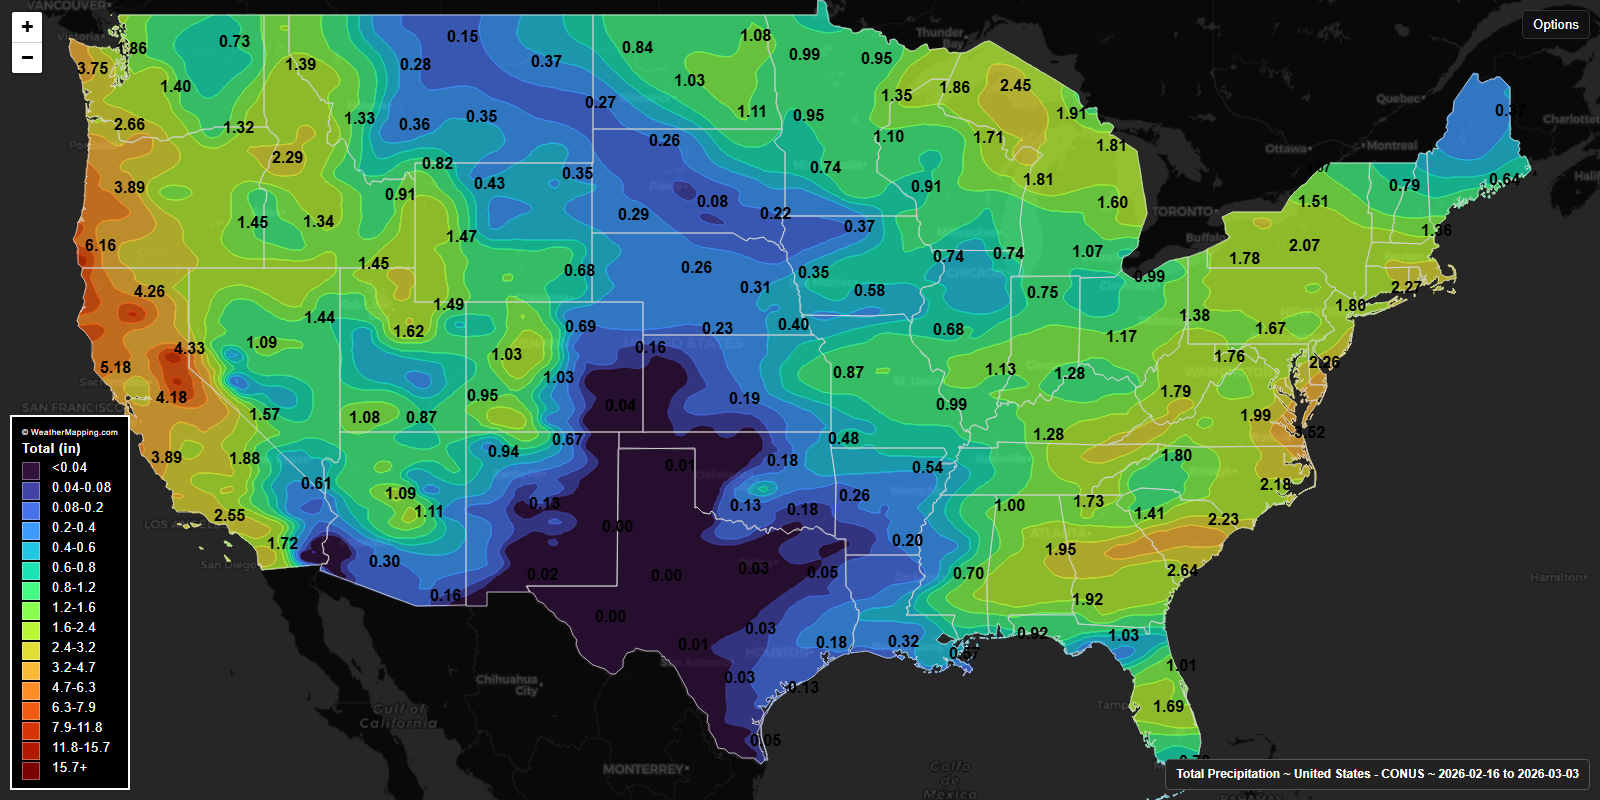
Total Precipitation (Last 15 Days)
Total accumulated precipitation over the previous fifteen days.
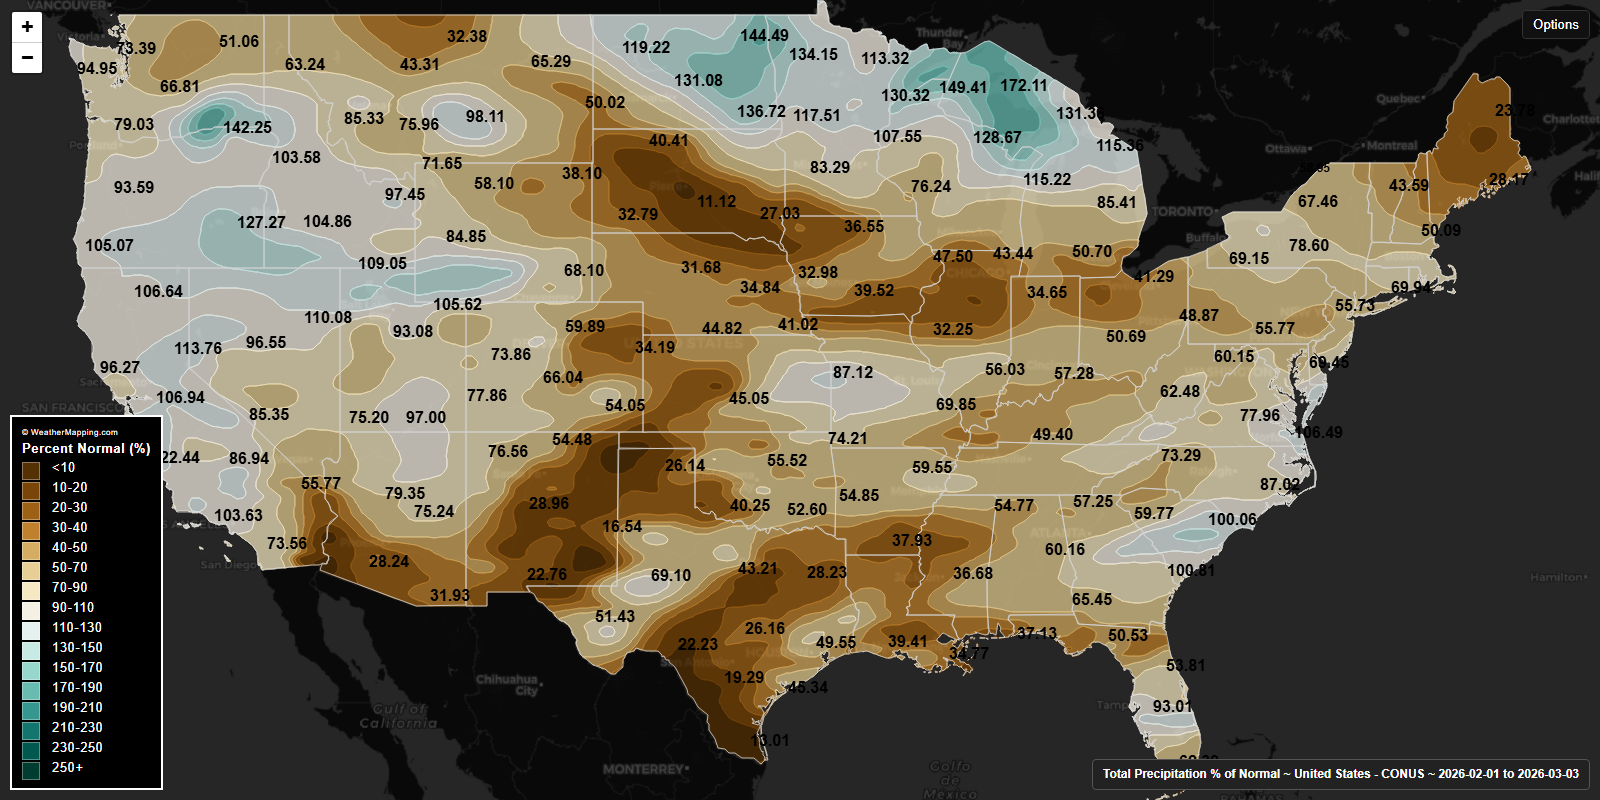
Percent of Normal Precipitation (Last 30 Days)
Precipitation expressed as a percentage of climatological normal over the past thirty days.
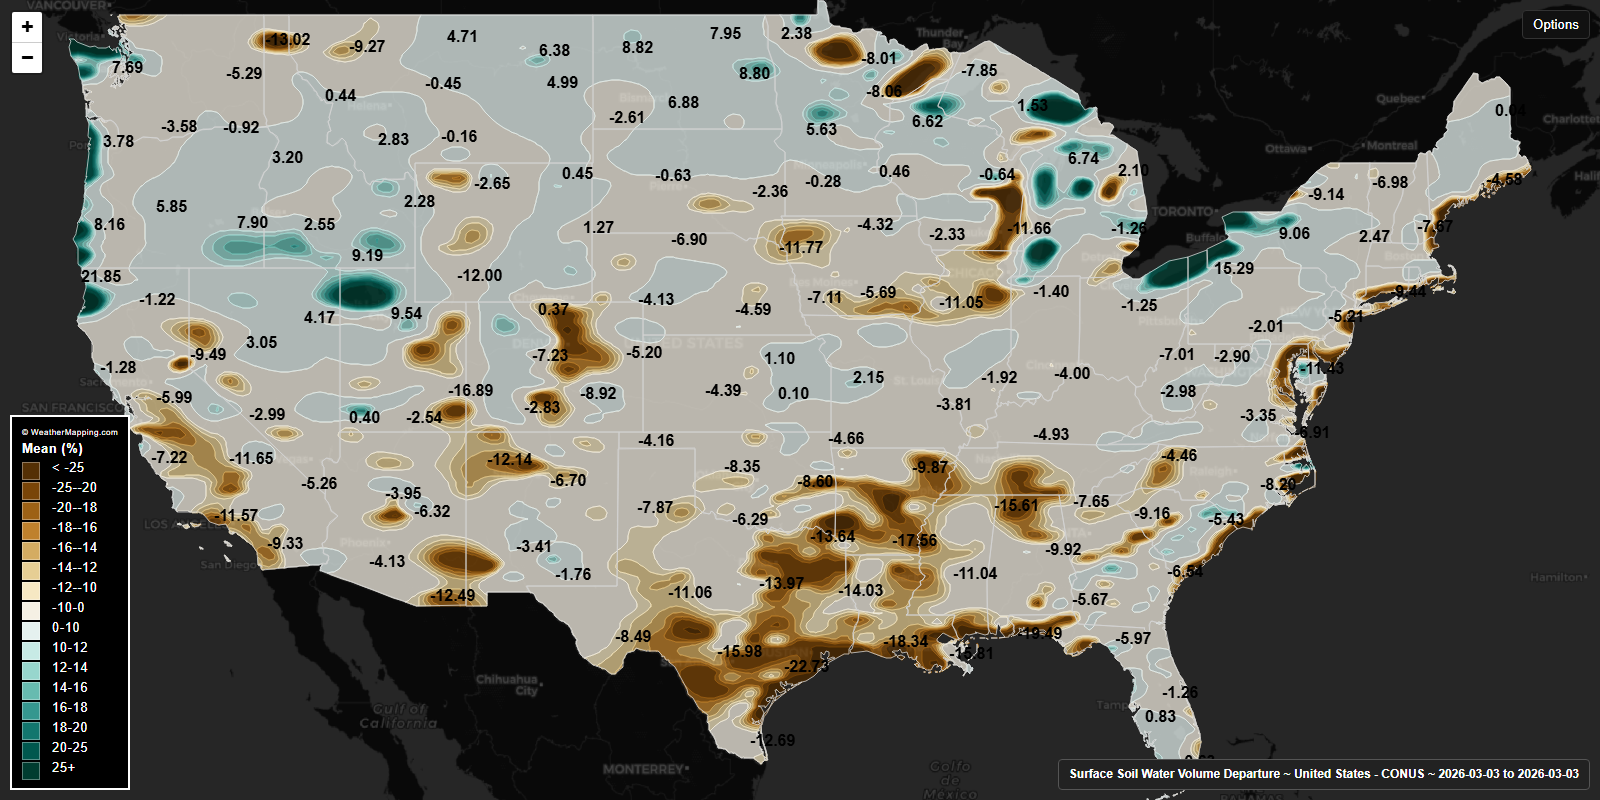
Surface Soil Moisture Departure
Daily departure of surface soil water volume from climatology.
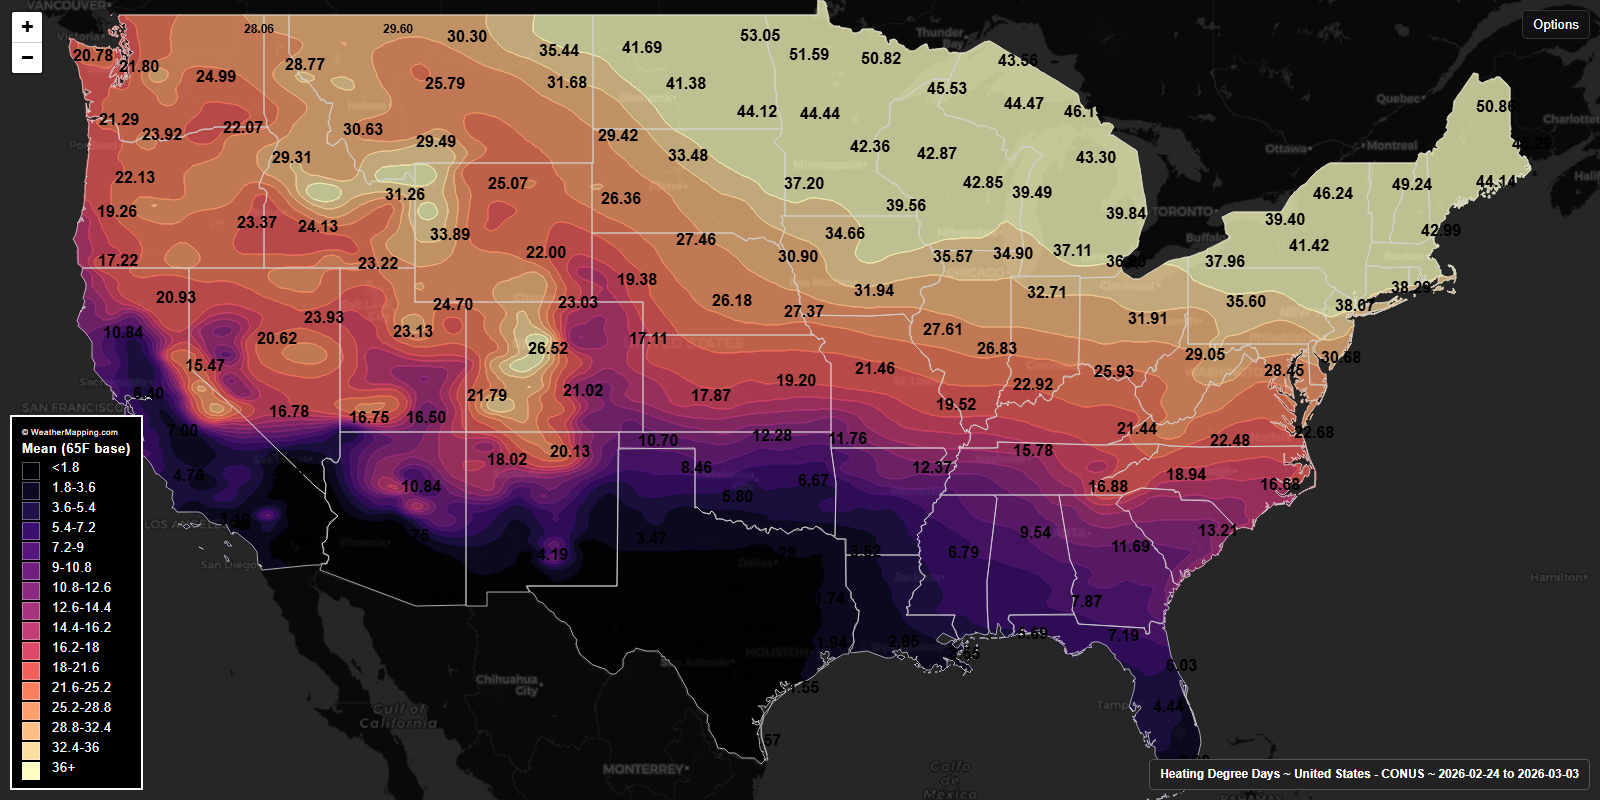
Heating Degree Days (Last 7 Days)
Daily mean heating degree days over the past seven days.
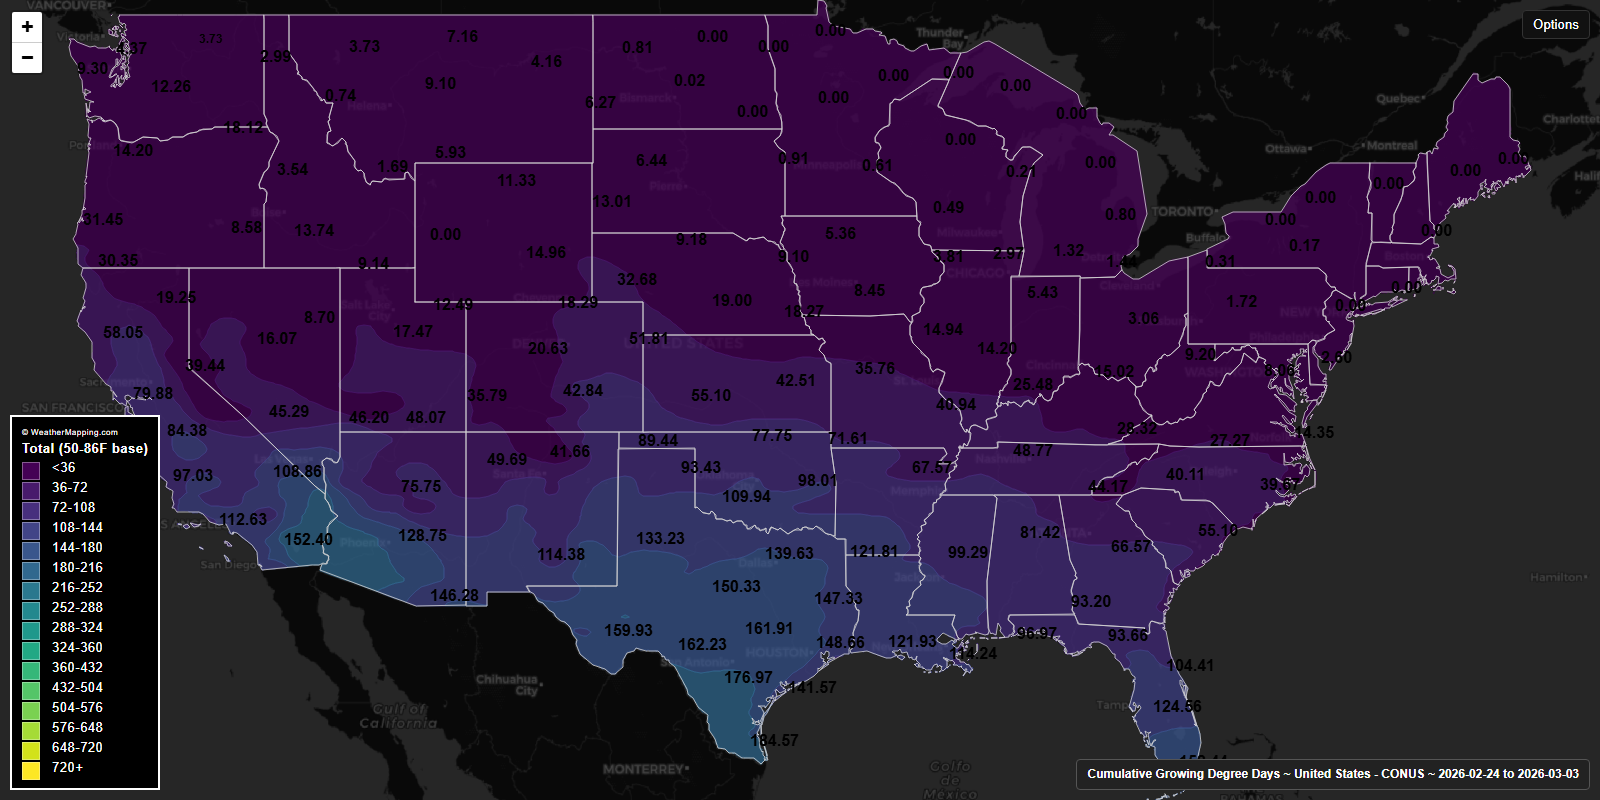
Cumulative Growing Degree Days (Last 7 Days)
Cumulative growing degree days accumulated during the past seven days.