Features
Welcome to WeatherMapping! The all-in-one weather intelligence application. The platform currently includes eight interactive modules for mapping, imaging, graphing, automation, data access, and AI-driven analysis (with more to come). Each feature is designed to help users explore, visualize, and understand real-time and historical weather conditions with professional-grade clarity. Use the menu buttons below to explore detailed overviews of each module, or simply scroll down to learn more about how WeatherMapping brings together mapping, automation, and AI-powered analysis in one unified platform.
Landing Page
When you log into the application, you'll be greeted with a clean, interactive landing page that displays all available modules. Each module tile includes a brief description - click on any tile to learn more, and press the Access button to launch the module directly.
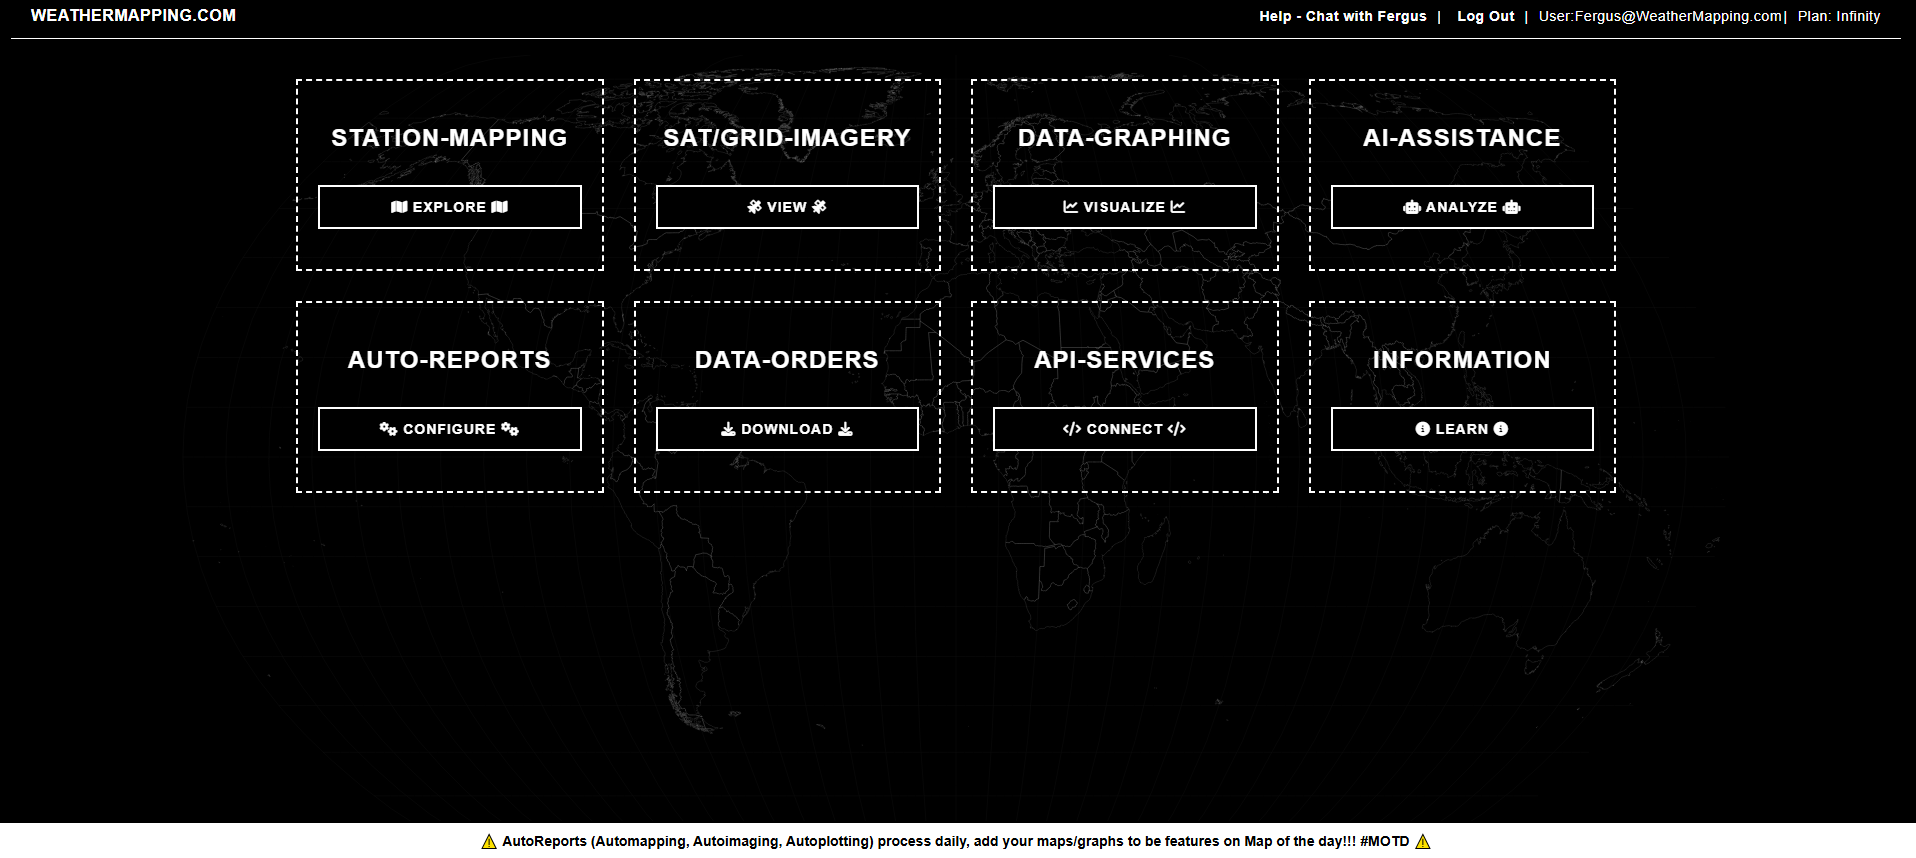
Your Weather Intelligence Dashboard - navigate between modules with a single click.
Access to modules depends on your subscription level, ensuring that every user enjoys a fast, dedicated experience without shared processing limits. From weather mapping and gridded satellite imagery to automated reports and API integration, the landing page lets you move seamlessly between tools, all in one place. For help or feedback, you can chat directly with the developers (including Dr. Fergus Keatinge, the lead dev of WeatherMapping) through the built-in support system at any time.
Station Mapping
Station Mapping is the foundation of WeatherMapping - the interactive engine where users explore, compare, and visualize global weather data. It brings together real observations and forecast data from weather stations worldwide, allowing you to view temperature, precipitation, wind, soil, and radiation data with the precision needed for daily-scale decision making.
Users can begin by selecting a location using hundreds of built-in predefined regions, choosing any country from the global list, or mapping a custom area based on the visible map view. The system supports both metric and imperial units, and lets you include climatology departures to highlight how current conditions differ from long-term averages.
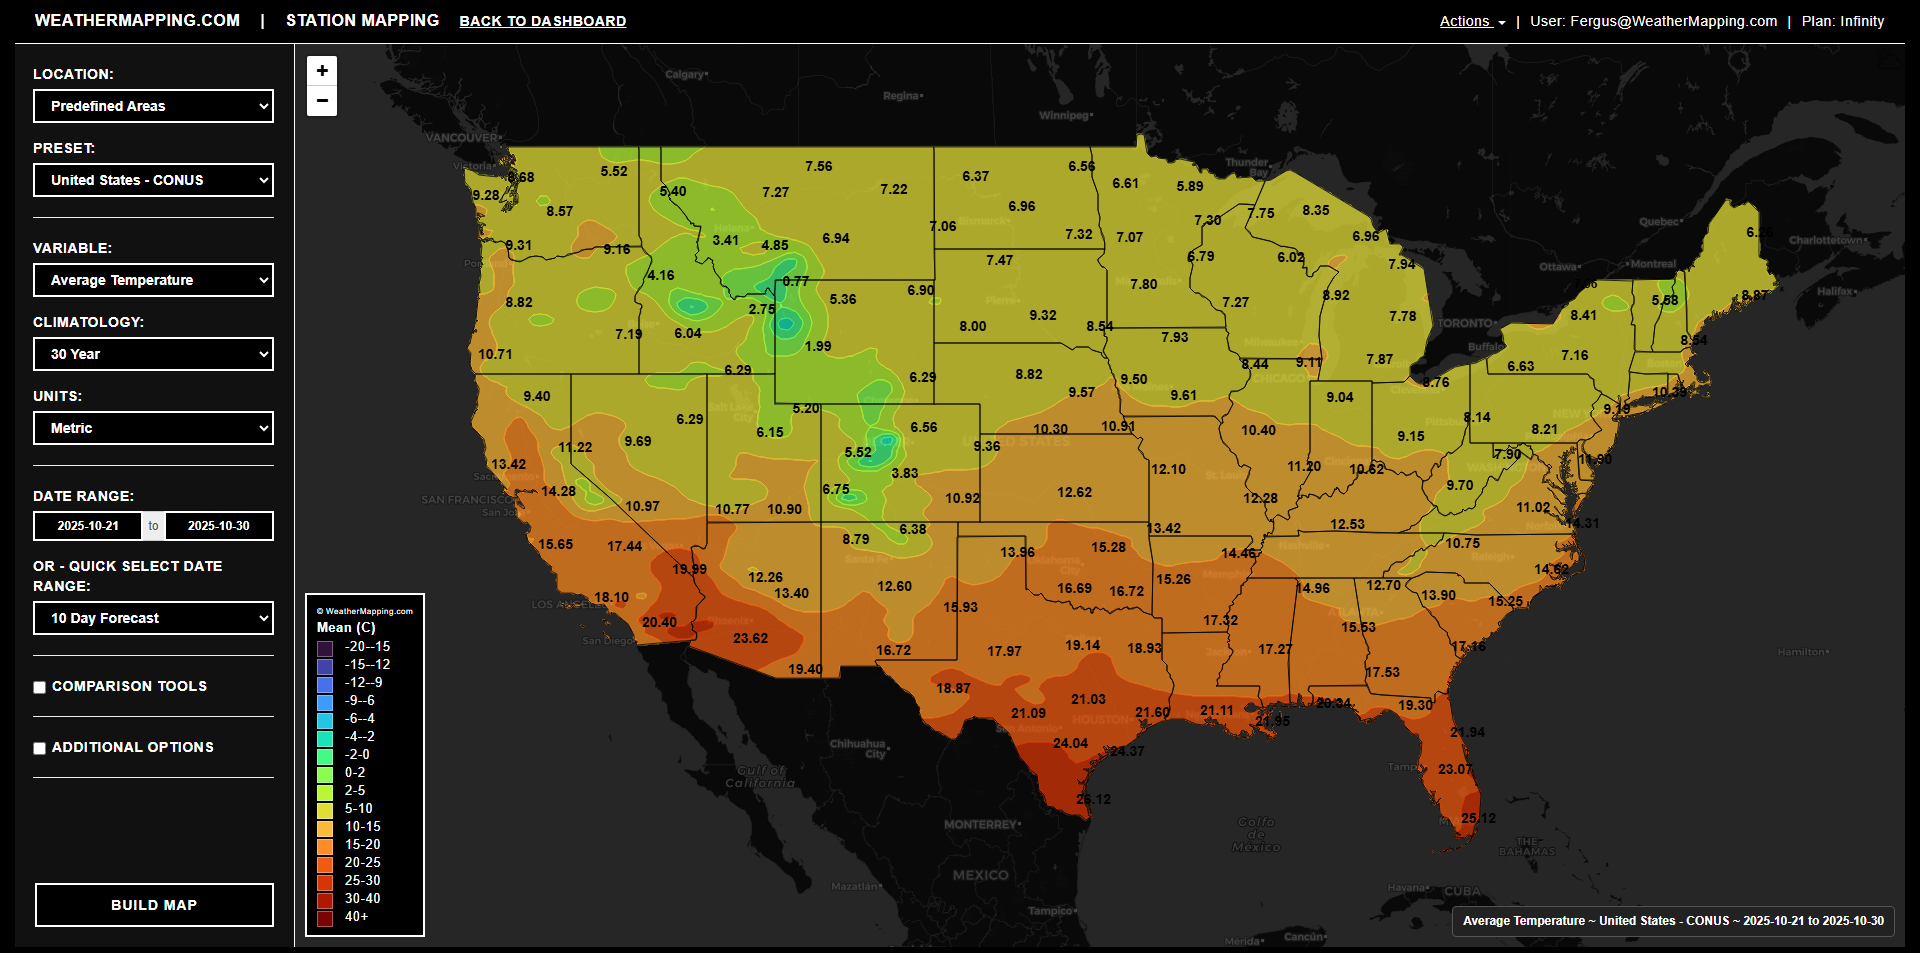
Example output generated from the WeatherMapping Station Mapping interface
Station Mapping provides complete control over time periods. Select custom date ranges or choose from quick presets such as 5-, 10-, 15-, 30-, or 90-day observations and forecast windows extending up to two weeks ahead. Built-in comparison tools let you analyze changes year-over-year, compare providers (Marcus Weather, ECMWF, GFS), or even examine differences between multiple runs of the same forecast model (for example, 00z vs 06z).
The sidebar gives fine-grained control over the look and feel of your map, from switching background layers (street, topographic, dark, or satellite), to adjusting map opacity, color palettes, and legend breaks manually or automatically. When ready, click Build Map to render the visualization, then download it, email it directly, or share it to LinkedIn, X, Facebook, or Reddit with a single click. Core and higher-tier users can also add any configuration to AutoReports for scheduled, automated generation.
Station Mapping transforms complex weather data into clear, interactive visuals, giving everyone from researchers and businesses to educators, hobbyists, and everyday weather enthusiasts a powerful way to explore, understand, and communicate changing conditions around the world.
Sat/Grid Imagery
Satellite Mapping gives users direct access to global satellite and gridded weather datasets, from rainfall and soil moisture to vegetation and sea surface temperature. It’s designed for professionals who need to visualize large-scale environmental patterns with precision and flexibility across both time and space.
Begin by selecting your area of interest using predefined regions, individual countries and states, or by using the custom map view as a selection tool. The module automatically loads the corresponding satellite and model data for your chosen area, allowing you to switch between variable families such as WeatherDataAI, Weather, Vegetation, Soil, and Sea. You can view IMERG precipitation grids, MODIS NDVI vegetation indices, SMAP soil data, and more - all in either Metric or Imperial units.
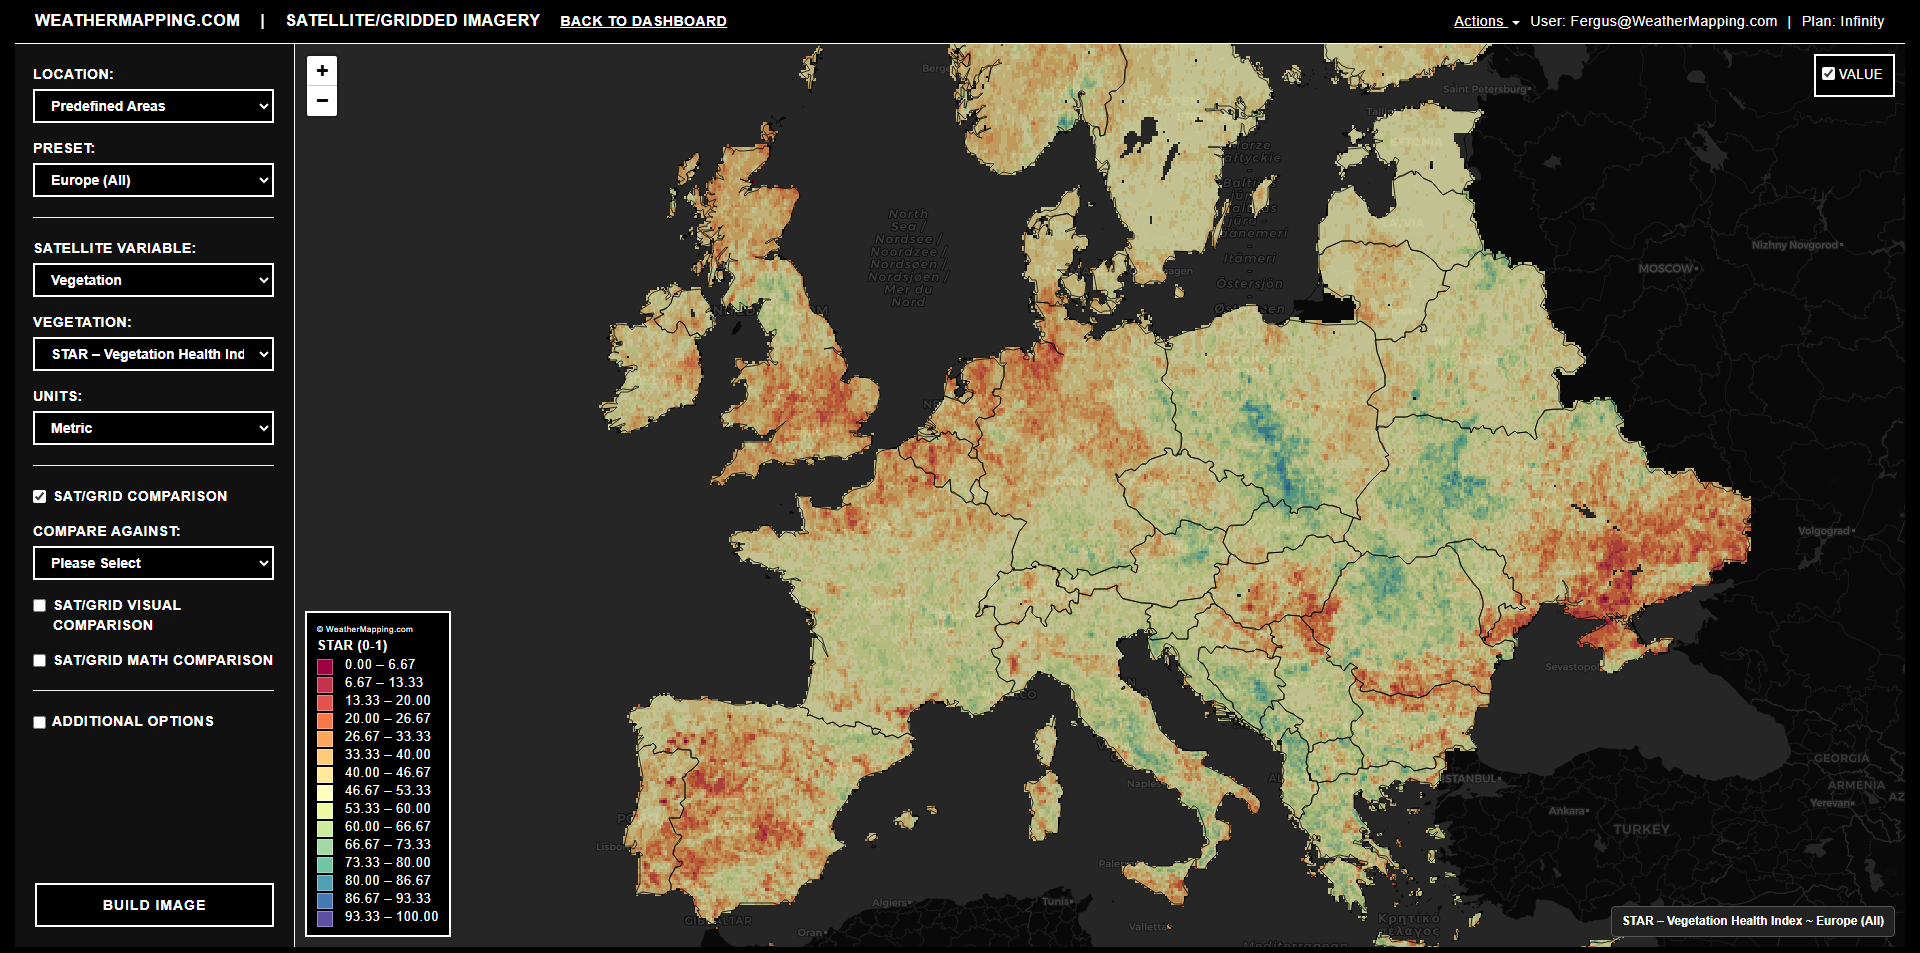
Example visualization of satellite-based global precipitation and vegetation indices
Satellite Mapping supports multiple comparison modes for benchmarking change over time. Users can overlay previous imagery from one week, one month, or even one year ago, or use mathematical difference layers to measure anomalies pixel by pixel. This makes it ideal for identifying drought emergence, vegetation stress, or sea-surface deviations from climatology. Visual comparisons help highlight subtle shifts, while math comparisons quantify them directly.
The viewing and legend options panel lets you adjust background maps, set opacity levels, and control how color scales and data breaks are generated. Users can rely on data-driven legends for automatic precision or manually define the color range, palette, and breakpoints for visual consistency across projects. Backgrounds include dark, topographic, imagery, and shaded-relief basemaps.
For any mapped area, zonal statistics can be calculated instantly, providing summary values such as mean, median, min, max, standard deviation, and percentiles (5th–95th). Results can be viewed in a table or downloaded as a CSV for analysis. Like with the Weather Mapping module, satellite images can be exported or shared directly from the platform - download as PNG, email the image, or post to LinkedIn, X, Facebook, or Reddit with a single click.
Satellite Mapping turns complex environmental grids into clear, interpretable visuals giving analysts, agronomists, and forecasters a single view of the Earth’s changing systems with accuracy, context, and speed.
Data Graphing
The Data Graphing tool transforms raw station data into clear, publication-ready charts that reveal how weather trends evolve across years, regions, and variables. It’s built for professionals who want to analyze patterns, detect anomalies, or visualize climatological baselines, all within seconds.
Users can start by selecting their location of interest, using predefined multi-country regions or focusing on an individual country and its states or provinces. Next, choose from the same 32 weather and geophysical variables available in the WeatherMapping module; including precipitation, temperature, degree days, wind, pressure, radiation, evaporation, and soil metrics, all selectable in either Metric or Imperial units, with optional departures from climatology for deeper context.
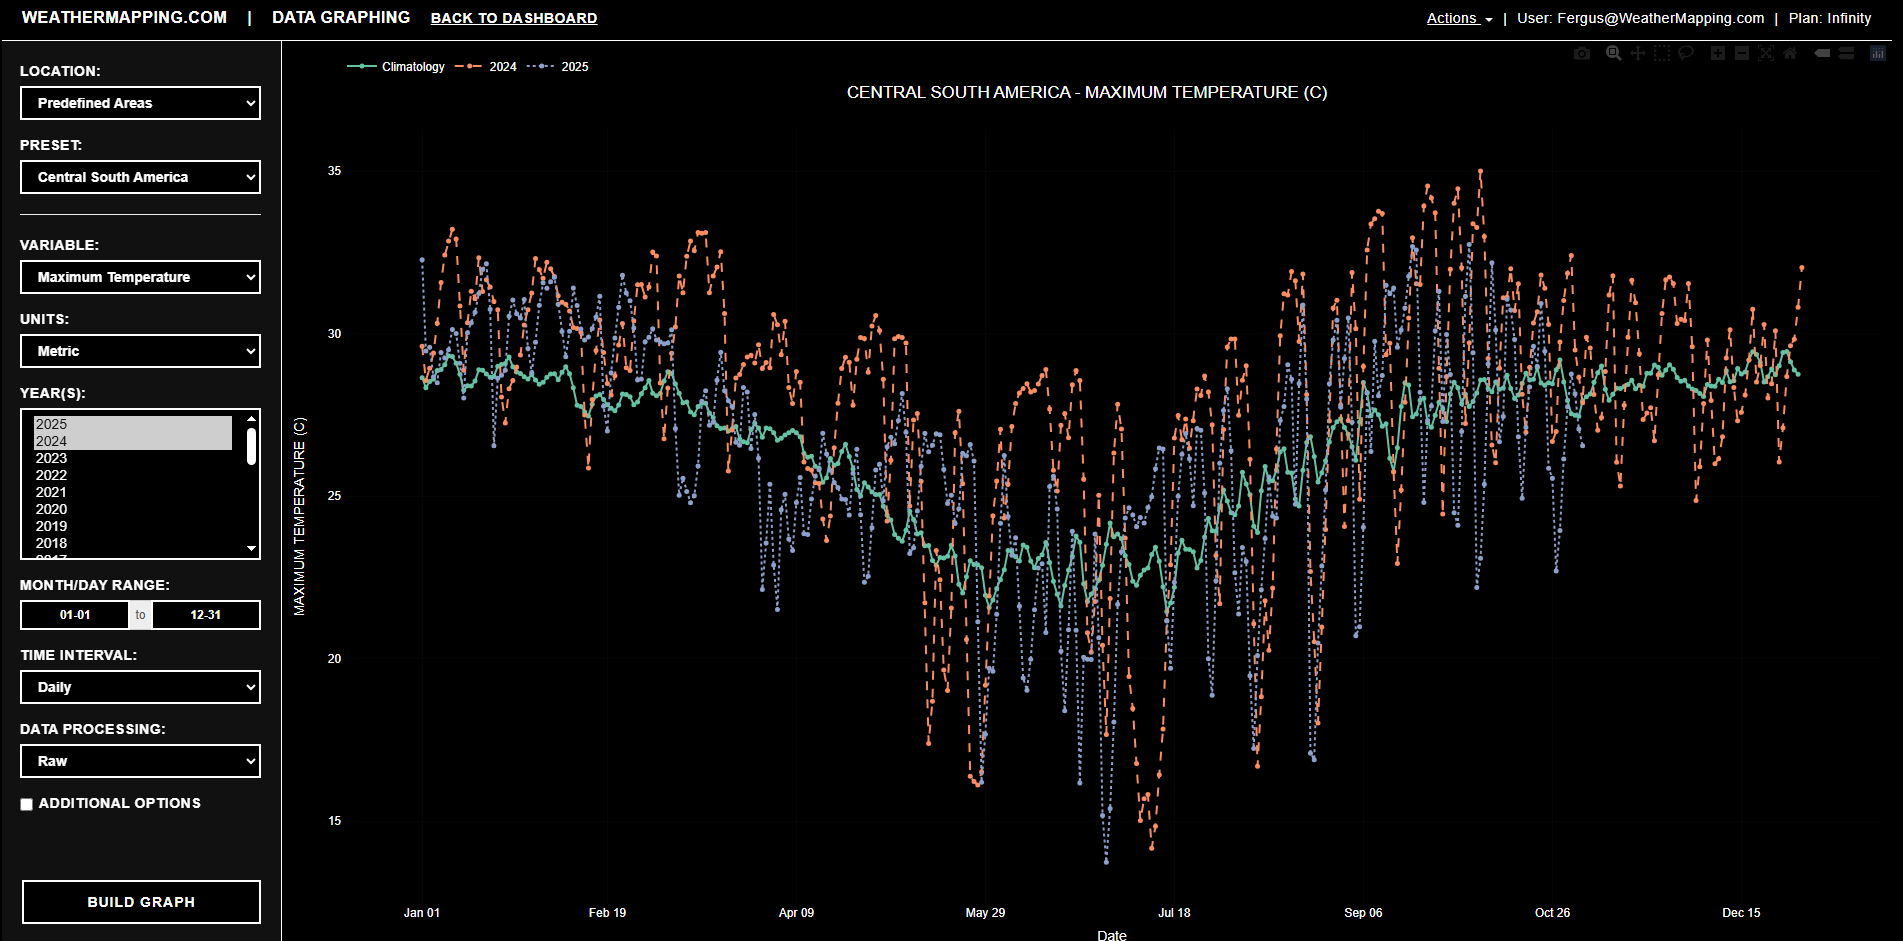
Example graph comparing multi-year precipitation anomalies using WeatherMapping
The module supports full control over time and aggregation. Users can select any combination of years - even extending back to 1980, and define a custom month-day range across calendar boundaries. Choose daily, weekly, or monthly intervals, and decide whether to plot raw values or cumulative totals. Overlay long-term climatology baselines to see how current conditions compare to historical norms.
Additional styling and processing options give you control over how data is displayed. Adjust line thickness, colors, or styles, and apply rolling averages to smooth noisy datasets. When you click Build Graph, each year or dataset is rendered as a color-coded line, hover over points to view exact values and units.
Once created, graphs can be easily shared, just like weather maps and satellite imagery, across social media or saved for your own use. Core and higher-tier users can also add graph configurations to AutoReports for scheduled generation and delivery.
Data Graphing turns thousands of data points into easy-to-read visualizations that help you track weather/climate behavior, validate forecasts, and communicate weather insights with confidence and clarity.
AI Assistance
The AI Weather Assistant, brings conversational weather intelligence to WeatherMapping. Ask natural questions, generate narrative summaries, or analyze weather patterns directly from live datasets.
Choose your location, variables, and time range, then let the AI instantly summarize trends, extremes, and anomalies across temperature, precipitation, and more. You can refine the output or ask follow-up questions in chat, for example, “When was the wettest day last month?” or “Compare this week’s forecast to last weeks weather”
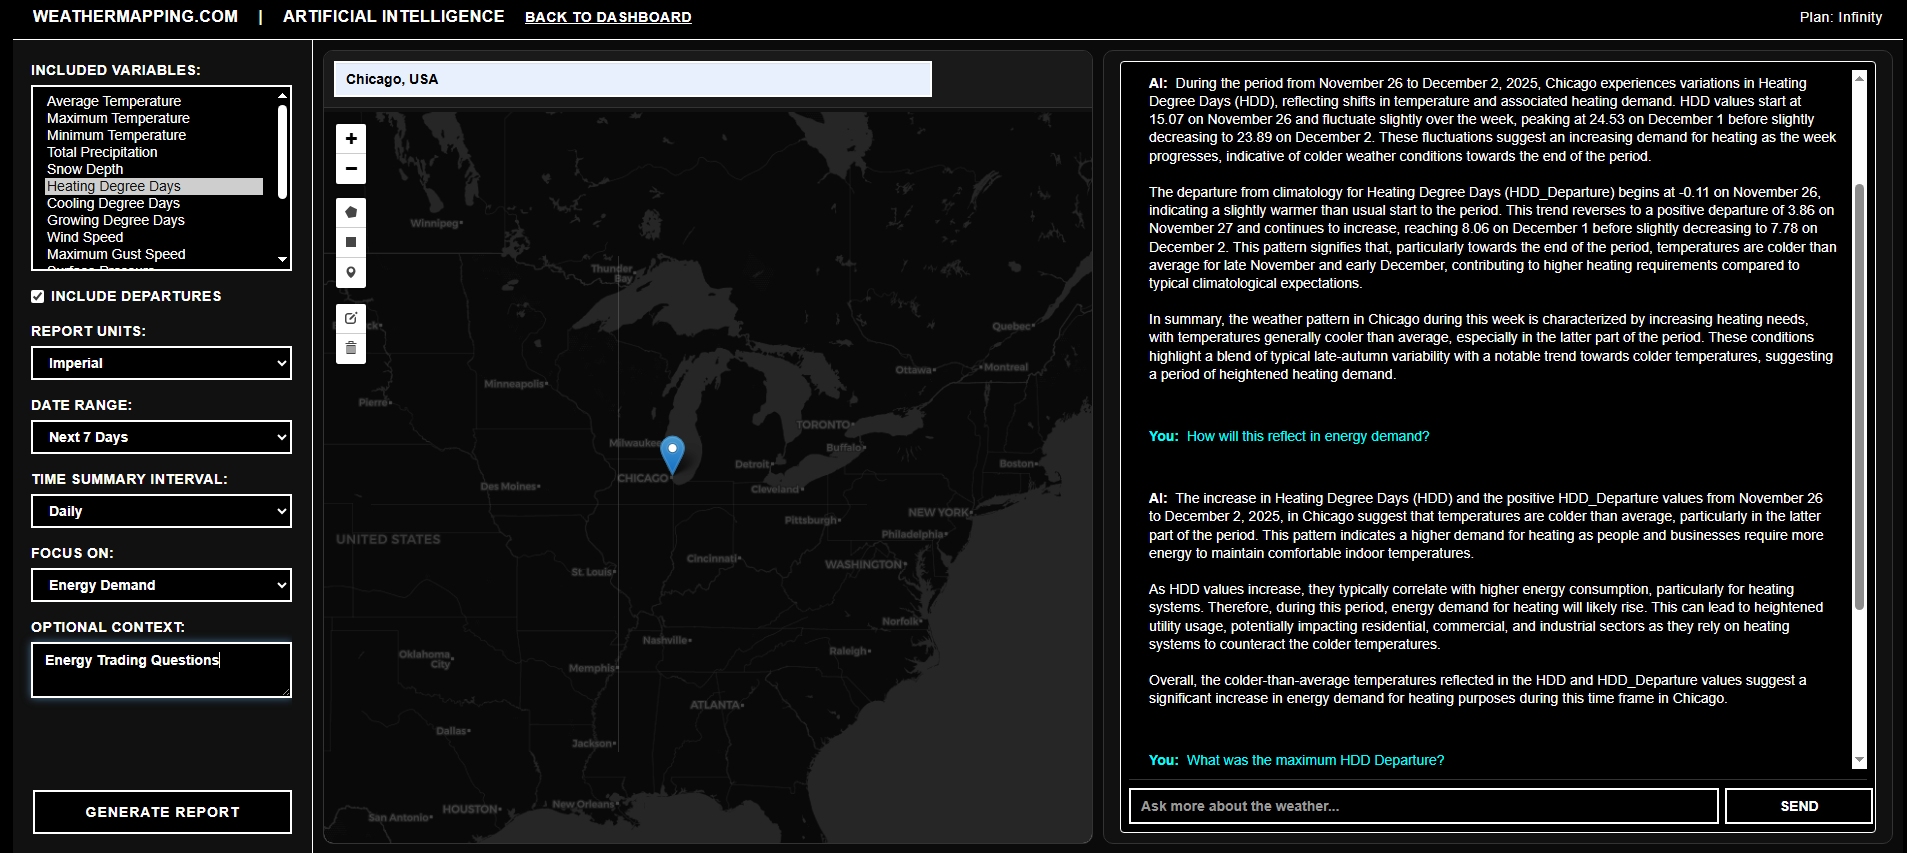
Example WeatherRobot summary generated from live weather data
Learn more at WeatherMapping.com/AI .
Auto Reports
Auto Reports is the automation engine of WeatherMapping. Designed to save you time by automatically generating maps, imagery, and charts each day after datadatabases have updated. Instead of manually rebuilding configurations each day or week, you can store and rerun them automatically for daily reporting cycles.
Every feature in WeatherMapping, Station Mapping, Satellite Imagery, and Data Graphing, connects directly with the Auto Reports Suite. Once you’ve configured a map or chart, you can save it as an Automap, and let WeatherMapping handle the rest. Reports are generated using the latest data and can be saved or emailed automatically. Each delivery includes both a static .png graphic and an interactive HTML version, allowing recipients to explore the map or graph directly without needing to open the app.
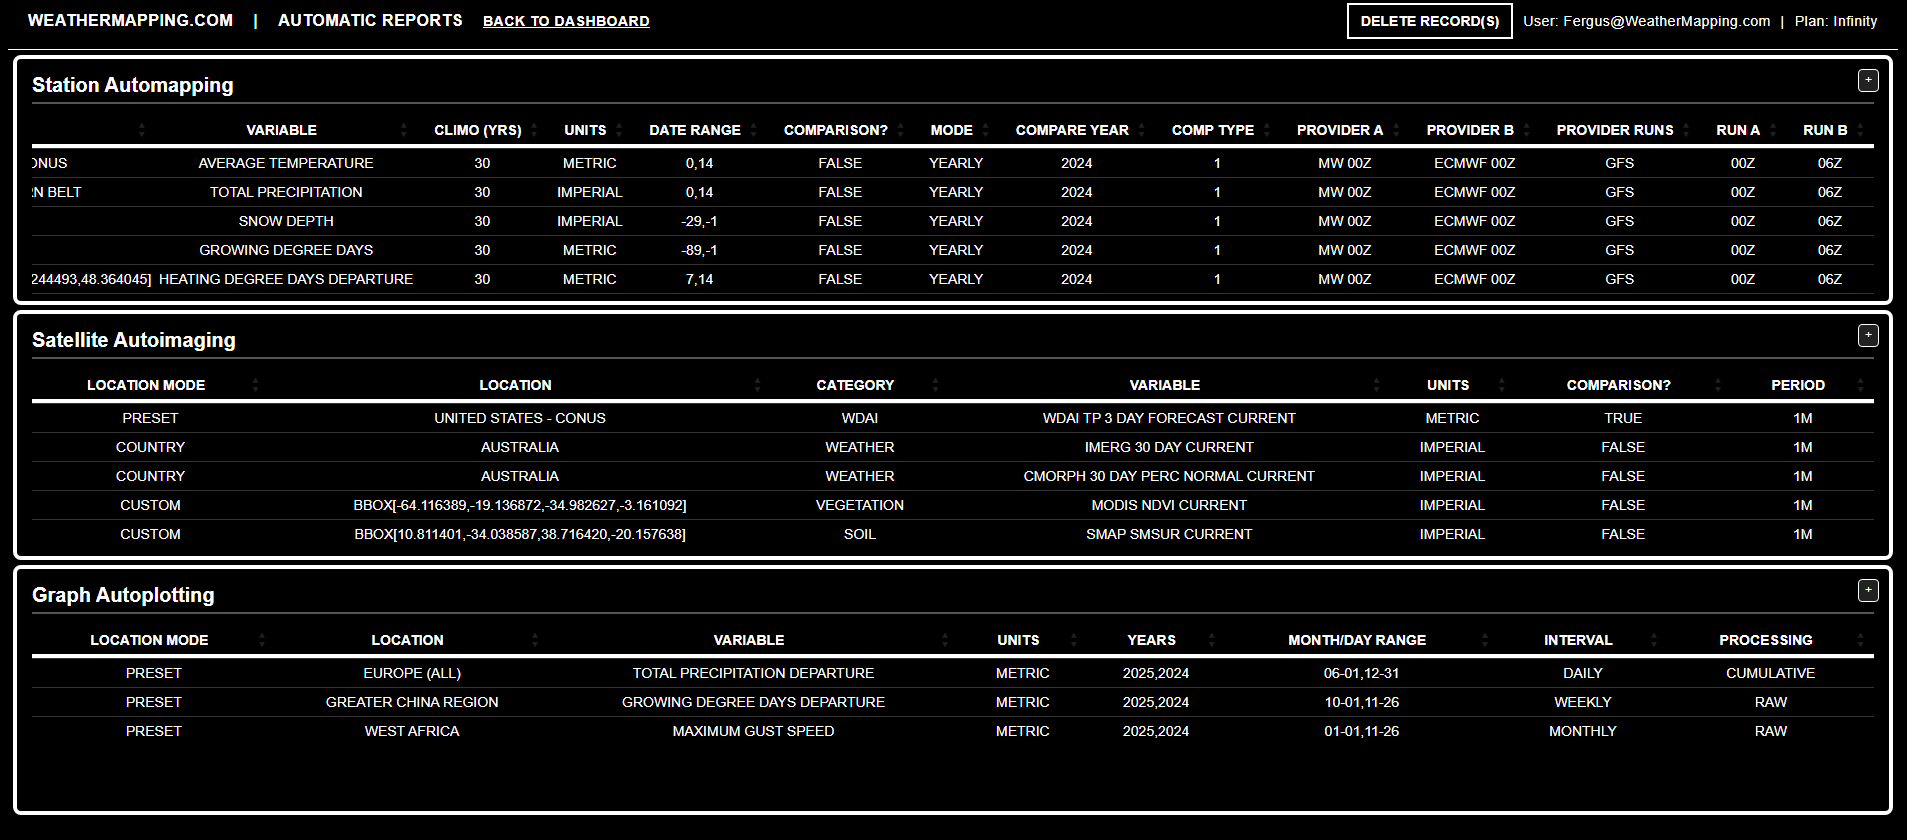
Example dashboard view showing scheduled Auto Reports across maps and charts
The Station Automapping feature automates generation of station-based weather maps for different regions, variables, and time ranges. Users can include comparisons between years or forecast providers, and even apply climatology departures to monitor ongoing patterns without logging in each day. Each map is rebuilt with updated data and archived automatically.
Satellite Autoimaging lets you capture and compare global satellite or gridded datasets automatically, from precipitation to vegetation to soil moisture. Apply your preferred unit system, choose custom color palettes, enable time-based comparisons (such as one week or one month ago), and receive the latest gridded satellite imagery updated daily.
The Graph Autoplotting module automates time-series chart creation, perfect for tracking multi-year trends or weekly updates. You can specify locations, select weather variables, define time intervals, and apply rolling averages or anomalies, then let the system regenerate those plots as new data arrives daily. We welcome the use of WeatherMapping graphics and reports in presentations, publications, and media (please ensure all redistributed images retain their original accreditation and branding).
The Auto Reports interface makes managing your reports simple, and if you no longer need one, just delete the row with a single click. Each subscription plan defines how many automaps can be stored at once: Core users can save up to 10, Enterprise up to 25, and Infinity plan users enjoy unlimited automation across all report types.
With Auto Reports, WeatherMapping becomes a self-updating system, generating and delivering the maps, imagery, and analytics you need automatically, so you can focus on interpretation instead of setup.
Data Orders
The Data Orders module provides direct access to WeatherDataAI’s acquisition platform. where users can purchase daily weather or geophysical datasets at very low cost rates. Whether you need decades of climate history or short-range forecasts, data is processed and delivered automatically in clean, analysis-ready formats.
All datasets available here are the same high-quality sources used throughout this application, powering the Weather Mapping, WeatherDataAI gridded imagery, and Data Graphing modules for consistent, validated results.
Two simple request forms make it easy to get started. The Gridded Data Request Form allows for regional or national-scale downloads, while the Point Data Request Form delivers detailed records for single coordinates. Both integrate directly with WeatherDataAI’s high-performance processing engine to ensure reliability, speed, and standardization.
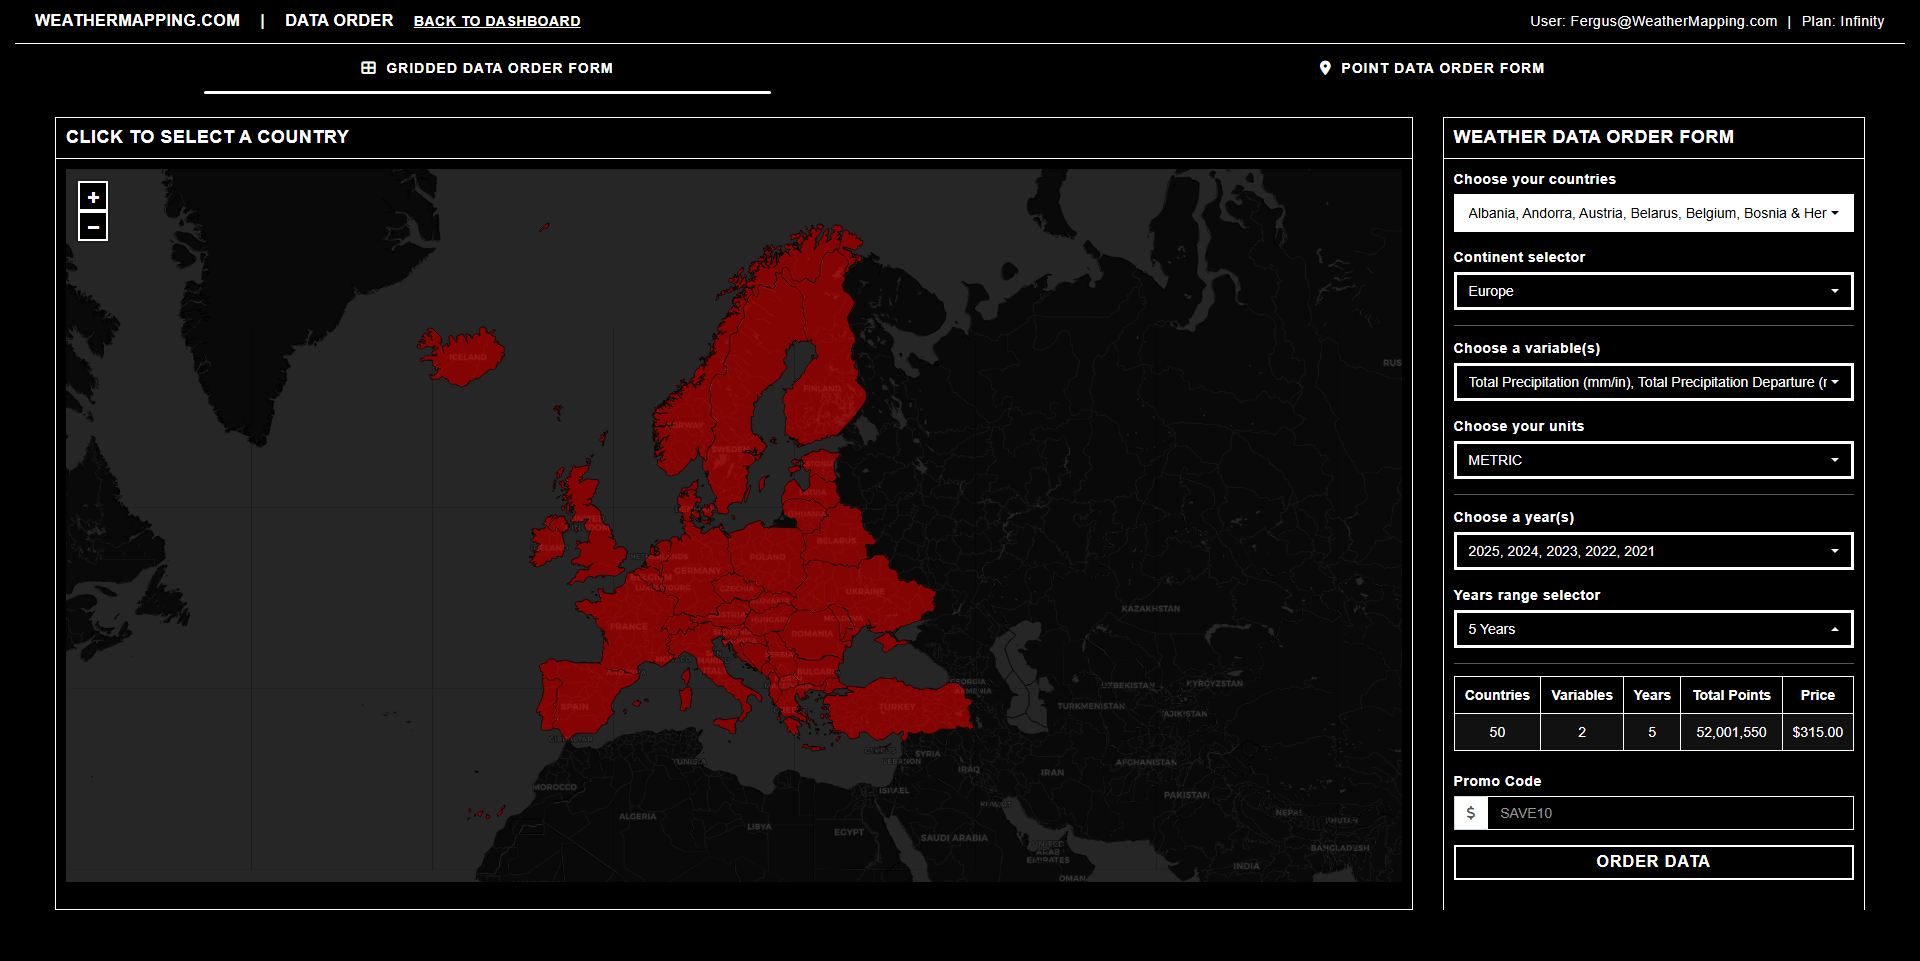
Example of the WeatherMapping Data Order interface for gridded datasets
The Gridded Data Request form lets you order large-area datasets across multiple latitude-longitude points. Select one or more variables such as precipitation, temperature, soil moisture, or wind; choose a date range (available daily since 1940); and define the spatial extent using bounding boxes, countries, or custom polygons. Once submitted, WeatherMapping processes and prepares your data automatically.
The Point Data Request form is ideal for single-location studies or site monitoring. Simply enter the exact latitude and longitude, select your variable and date range, and download clean daily records or forecast extensions for that exact site. This form is perfect for energy, agriculture, insurance, or infrastructure applications that rely on precise local data.
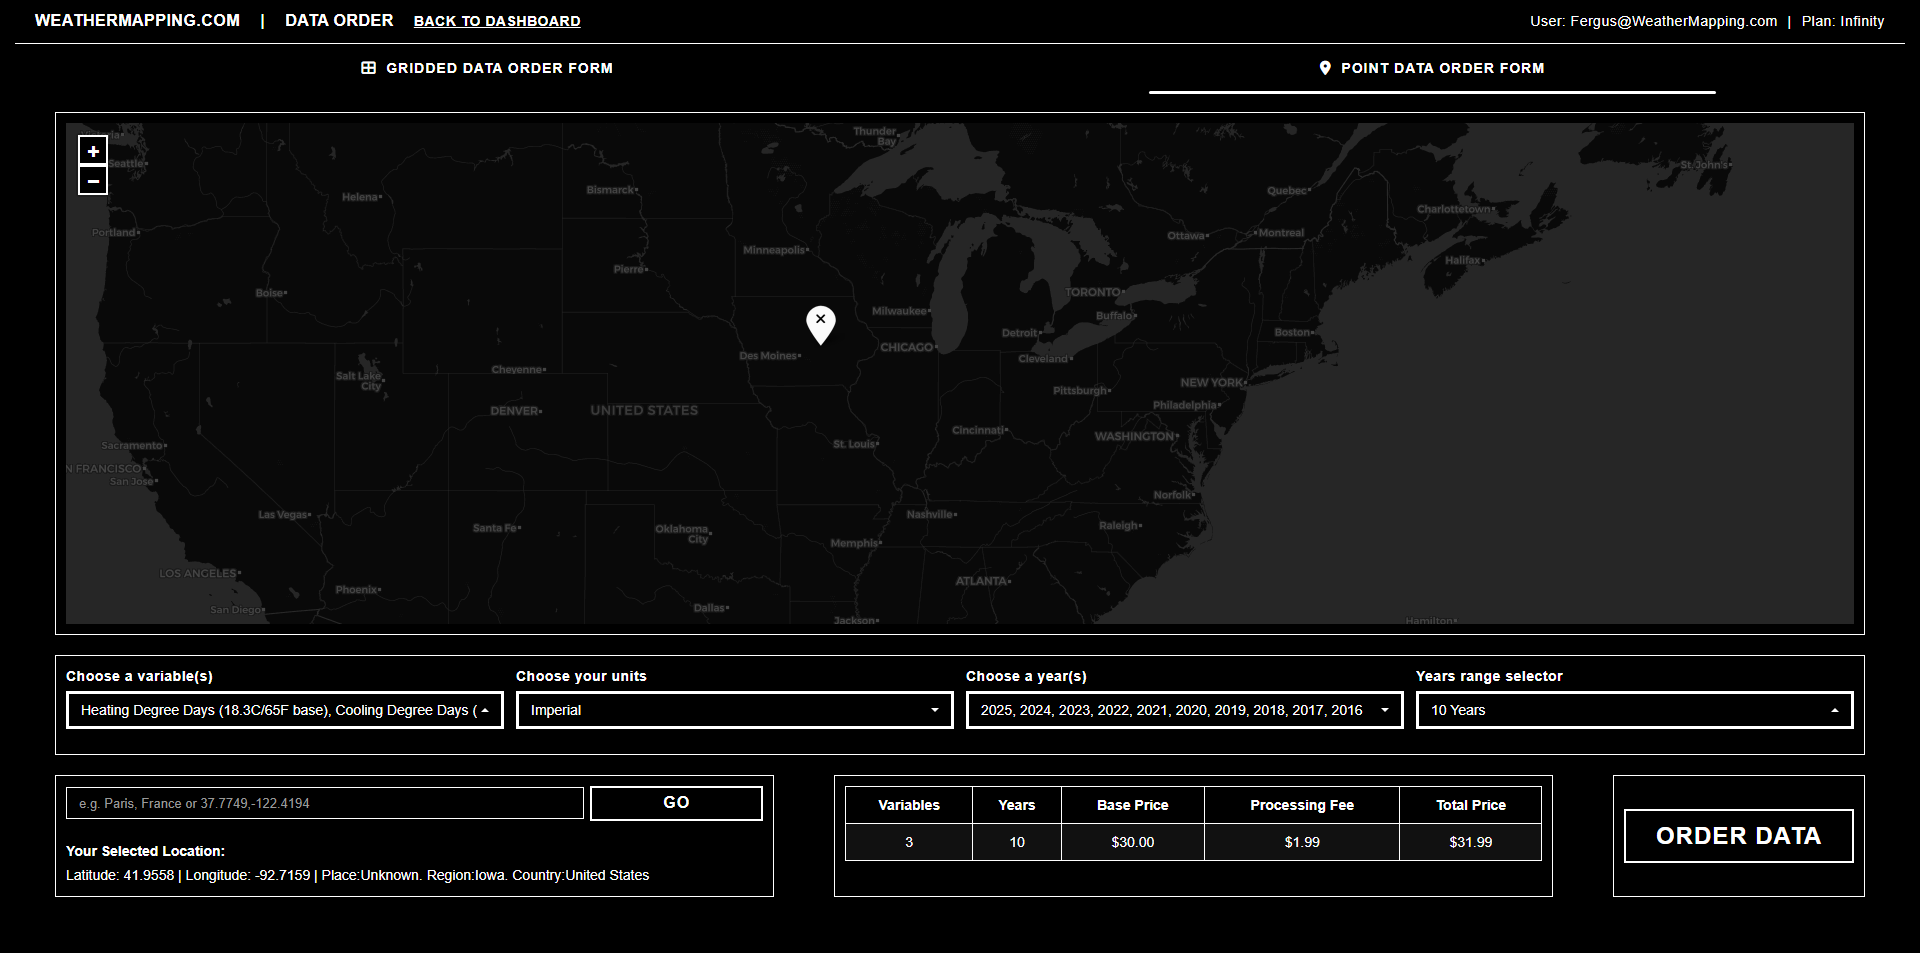
Example of the WeatherMapping Data Order interface for point datasets
All data requests are processed in the cloud and delivered as standardized CSV files - each with complete metadata including units, source, and processing notes. Larger requests are provided through secure S3 download links, and every order includes an email notification with download access once processing is complete.
API Services
The API Services module provides secure, programmatic access to all WeatherDataAI datasets, from global historical archives to real-time forecasts. Designed for developers, analysts, and integrators, it supports both bulk downloads and live on-demand queries for any coordinate or variable.
The WeatherDataAI API follows a RESTful structure and allows you to query observations dating back to 1940 or forecasts extending up to 15 days ahead. Each request specifies a dataset type (Observation or Forecast), variable, latitude/longitude, date range, and unit system (Metric or Imperial). Results are returned in CSV formats, ready for immediate integration.
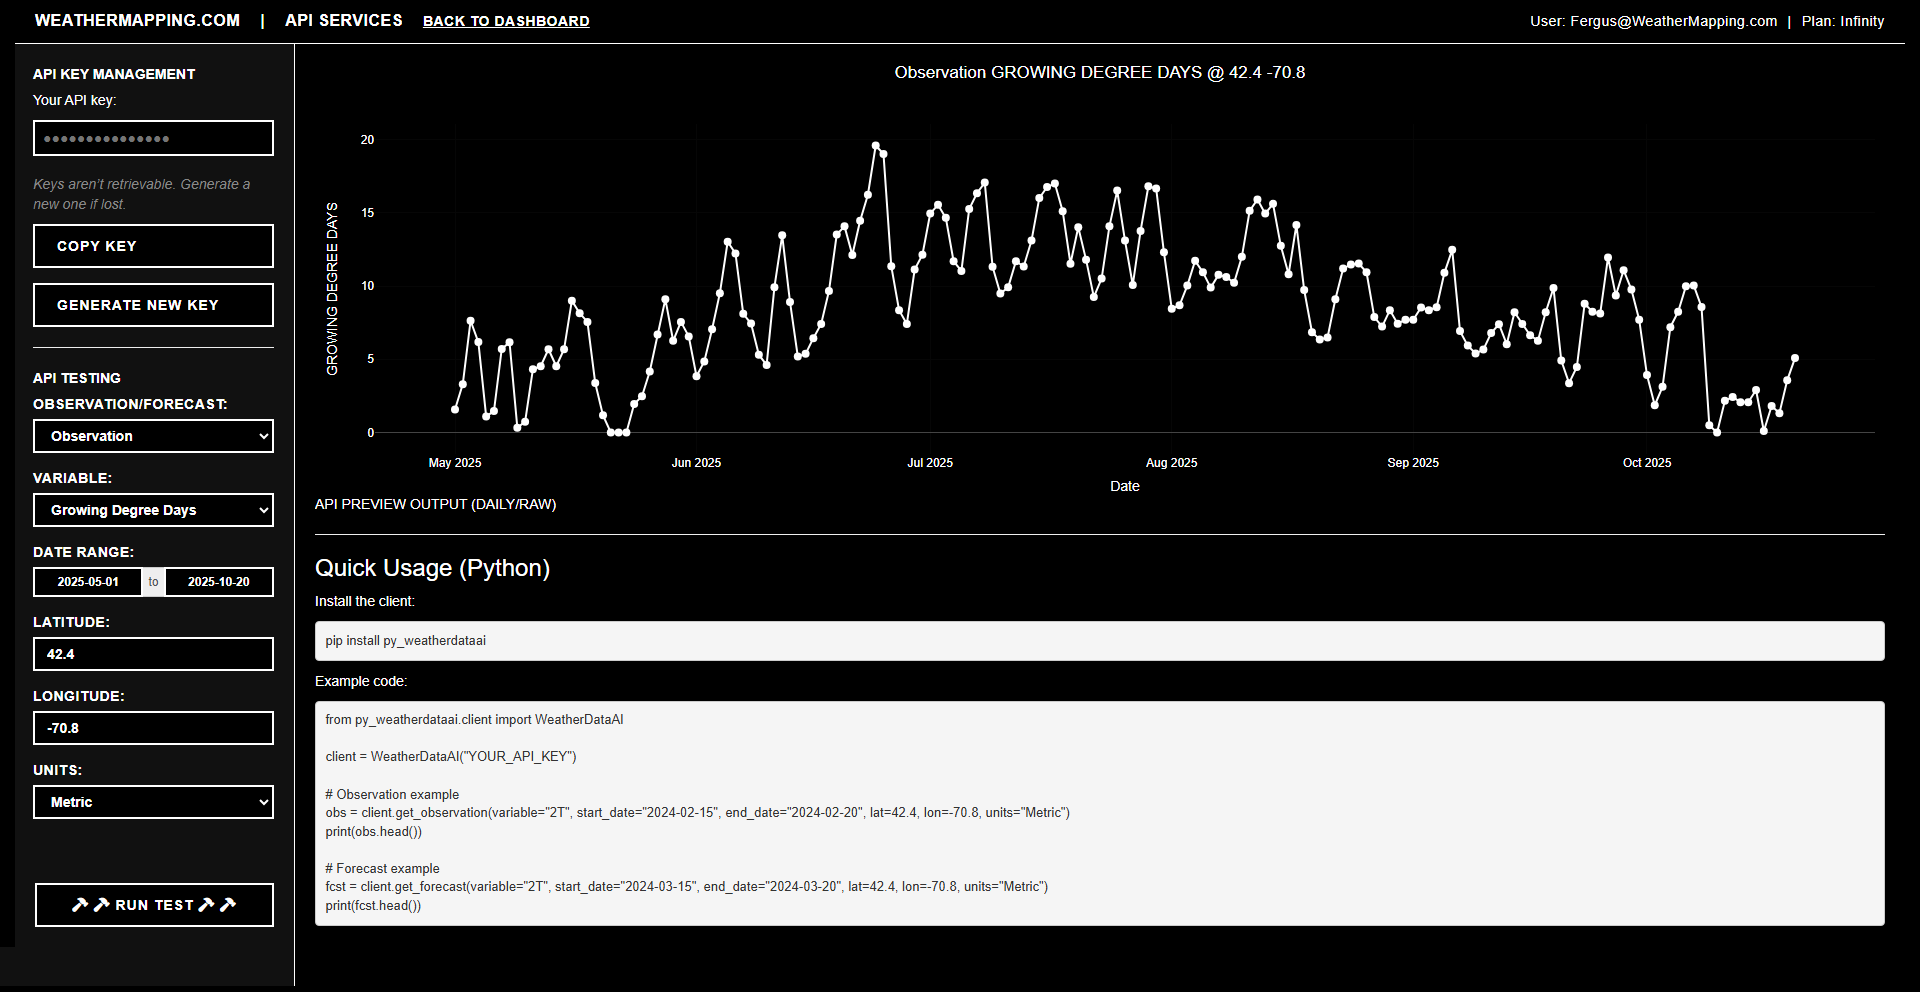
Example API dashboard showing live key management and query testing inside WeatherMapping
Each user is provided with a personal API key linked to their account. You can generate, rotate, or revoke keys directly in the dashboard. Lost keys cannot be recovered, but new ones can be issued instantly. Keeping your key secure ensures uninterrupted access to WeatherDataAI’s services.
A built-in API Console allows you to run live test queries directly within WeatherMapping. Simply choose a dataset type, variable, and date range, enter a latitude and longitude, and click Run Test. Results appear instantly, including a small plot and raw CSV preview of your API response.
Developers can also connect using the official Python package:
pip install py_weatherdataai

from py_weatherdataai.client import WeatherDataAI

client = WeatherDataAI("YOUR_API_KEY")

# Observation example
obs = client.get_observation(variable="2T", start_date="2024-02-15", end_date="2024-02-20", lat=42.4, lon=-70.8,  units="Metric")
print(obs.head())

# Forecast example
fcst = client.get_forecast(variable="2T", start_date="2024-03-15", end_date="2024-03-20",  lat=42.4, lon=-70.8,  units="Metric")
print(fcst.head())
API usage is metered according to your subscription plan, which defines rate limits (calls per second), daily and monthly quotas, and data volume thresholds. Total API calls are soft monitored, we will inform you if you are exceeding your monthly quota.
The API Services suite brings full programmatic access to the WeatherDataAI ecosystem, enabling seamless integration with third-party platforms, automated analytics pipelines, and AI workflows, all powered by the same global weather intelligence that drives WeatherMapping.
Information & Documentation
The Information Hub is your go-to reference for learning how to use every feature of WeatherMapping. It includes visual guides, in-app tooltips, workflow tutorials, and quick troubleshooting help, all accessible from inside the dashboard.
Explore in-depth documentation for:
- Station Mapping – Live global observations
- Satellite Mapping – Forecast and anomaly imagery
- Data Graphing – Multi-year visual comparisons
- Auto Reports – Scheduled and repeatable mapping tasks
- Data Orders – Bulk dataset downloads
- API Services – Secure programmatic data access
- AI Assistance – Conversational analytics and summaries
Each module includes its own documentation tab and help overlay, so you can access guidance directly where you’re working. Release notes and feature updates are also available inside the Information Hub, ensuring you’re always up-to-date with the latest platform changes.
Access the in-app documentation via the Information section of your WeatherMapping dashboard, or visit the Help & Release Notes panel inside the app footer.